Category Archives: R, Stata, Matlab

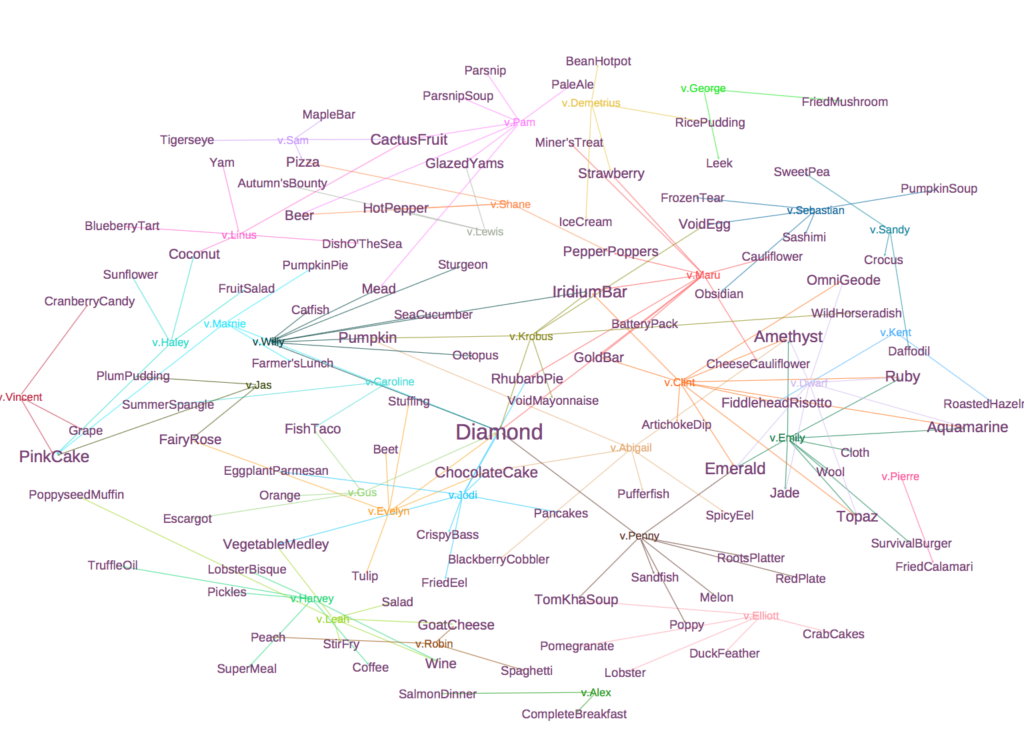
An efficient way to give gifts in Stardew Valley

I was playing Stardew Valley recently... well, it consumed much of my weekends...

In the game, the player has to give gifts to all villagers to keep a good relationship with them. There is an official page displaying each one's preference, wiki. However, my life will be much easier if I can minimize the amount of distinct gifts I carry every day. When there is an optimization question, there is an analytical solution 🙂

My approach:

Use wiki's data as input, then identify the items that are favored by more than one villagers, and easy to obtain regardless of the season...as a result, I can arrange production and carriage easily and efficiently.

Output:

A network graph that shows how villagers are connected by gifts.

screen-shot-2016-11-06-at-6-52-54-pm

Source codes:

gift = read.csv("stardew valley gift.csv/Sheet 1-Table 1.csv", stringsAsFactors = F)

names(gift)

expand.gift = apply(gift, 1, 
      function (x) {
        gift_list = unlist(strsplit(x[2],"\n "))
        data.frame(v = x[1], g = gift_list)
        }
      )
expand.gift = do.call(rbind, expand.gift)

expand.gift$v = gsub("\n","",expand.gift$v)
expand.gift$g = gsub("[[:space:]]","",expand.gift$g)
expand.gift$v = paste0("v.",expand.gift$v)
names(expand.gift) = c("source","target")
write.csv(expand.gift, file = "expand.gift.csv", row.names = F)
expand.gift = subset(expand.gift, ! g %in% c("Prismatic Shard","Rabbit's Foot"))

expand.gift.mul = merge(expand.gift, expand.gift,
                        by.x = "v",by.y = "v")
expand.gift.mul = subset(expand.gift.mul, g.x!= g.y)

library(igraph)
gift.n = graph_from_edgelist(as.matrix(expand.gift.mul[,2:3]), T)
gift.n = as.undirected(gift.n, mode = "mutual")
V(gift.n)$size <- 1
l <- layout_with_kk(gift.n)
plot(gift.n,layout=l, vertex.label.cex	 = 0.7)

write_graph(gift.n, file = "svgift.gml",format = "gml")

Original dataset:
sheet-1-table-1.csv

Vector graph output:
svgift.pdf

Forward: Statistical Software Award - 2011

Sorry, it has been really a long period of time since my last update. Forgive me but I haven't got anything new in academic so I don't want to waste your time.

Just now received an email from Yihui, and I'd like to forward and post it here. Pay attention if you are interested.

John M. Chambers Statistical Software Award - 2011

Statistical Computing Section
American Statistical Association

The Statistical Computing Section of the American Statistical
Association announces the competition for the John M.  Chambers
Statistical Software Award. In 1998 the Association for Computing
Machinery presented its Software System Award to John Chambers for the
design and development of S. Dr. Chambers generously donated his award
to the Statistical Computing Section to endow an annual prize for
statistical software written by an undergraduate or graduate student.
The prize carries with it a cash award of $1000, plus a substantial
allowance for travel to the annual Joint Statistical Meetings where
the award will be presented.

Teams of up to 3 people can participate in the competition, with the
cash award being split among team members. The travel allowance will
be given to just one individual in the team, who will be presented the
award at JSM.  To be eligible, the team must have designed and
implemented a piece of statistical software.  The individual within
the team indicated to receive the travel allowance must have begun the
development while a student, and must either currently be a student,
or have completed all requirements for her/his last degree after
January 1, 2009.  To apply for the award, teams must provide the
following materials:

Current CV's of all team members.

A letter from a faculty mentor at the academic institution of the
individual indicated to receive the travel award.  The letter
should confirm that the individual had substantial participation in
the development of the software, certify her/his student status
when the software began to be developed (and either the current
student status or the date of degree completion), and briefly
discuss the importance of the software to statistical practice.

A brief, one to two page description of the software, summarizing
what it does, how it does it, and why it is an important
contribution.  If the team member competing for the travel
allowance has continued developing the software after finishing
her/his studies, the description should indicate what was developed
when the individual was a student and what has been added since.

An installable software package with its source code for use by the
award committee. It should be accompanied by enough information to allow
the judges to effectively use and evaluate the software (including
its design considerations.)  This information can be provided in a
variety of ways, including but not limited to a user manual (paper
or electronic), a paper, a URL, and online help to the system.

All materials must be in English.  We prefer that electronic text be
submitted in Postscript or PDF.  The entries will be judged on a
variety of dimensions, including the importance and relevance for
statistical practice of the tasks performed by the software, ease of
use, clarity of description, elegance and availability for use by the
statistical community. Preference will be given to those entries that
are grounded in software design rather than calculation.  The decision
of the award committee is final.

All application materials must be received by 5:00pm EST, Monday,
February 21, 2011 at the address below.  The winner will be announced
in May and the award will be given at the 2011 Joint Statistical
Meetings.

Information on the competition can also be accessed on the website of
the Statistical Computing Section (www.statcomputing.org or see the
ASA website, www.amstat.org for a pointer), including the names and
contributions of previous winners.  Inquiries and application
materials should be emailed or mailed to:

Chambers Software Award
c/o Fei Chen
Avaya Labs
233 Mt Airy Rd.
Basking Ridge, NJ 07920
feic@avaya.com

[Play Econometrics with R] Preview for Chapter 1-2 released!

I'm glad to announce that now the preview version for my brochure Play Economics with R has been released! This time I publish the first two chapters, which were just finished several days ago. At present it is written in Chinese, so there is only an English content for none-Chinese readers.

Content

Chapter 1 Get familiar with R

1.1 Data Import...................................... 6
1.2 Summary the data....................................... 7
1.2.1 Average value..................................... 7
1.2.2 Linear regression (ordinary least squares, OLS).................... 8
1.3 Plot a regreesion figure...................................... 9
1.4 Point prediction......................................... 10
1.5 Multiple linear regression..................................... 10
1.6 Save and edit the code.................................... 11
1.7 Search for help....................................... 11

Chapter 2 Start from cross-section data

2.1 Parameter test....................................... 12
2.1.1 t test..................................... 13
2.1.2 F test..................................... 13
2.2 Confidence Intervals....................................... 14
2.3 Dummy variables....................................... 14
2.3.1 grouped by the nature.................................. 14
2.3.2 grouped by the value................................. 14
2.3.3 interaction items................................... 15
2.3.4 specify the based group.................................. 17
2.4 Heteroscedasticity test...................................... 18
2.4.1 BP test (Breusch-Pagan Test)........................ 19
2.4.2 White test (White test for heteroskedasticity)................ 20
2.5 Robust standard deviation...................................... 20
2.6 Weighted least squares estimation (WLS).............................. 21
2.6.1 with disturbance form known ............................... 21
2.6.2 feasible generalized least squares (Feasible GLS, FGLS)................ 22
2.7 Generalized Linear Estimation (GLM)................................. 24
2.7.1 Maximum Likelihood Estimation (MLE).......... 25
2.7.2 Probit and Logit models.............................. 25
2.7.3 Tobit model................................... 26
2.7.4 Ordered Logit / Probit............. 27
2.8 Count Model............................... 28
2.8.1 Poisson Regression Model................... 28
2.8.2 test for dispersion.............................. 29
2.8.3 Negative binomial regression model............. 30
2.8.4 Zero-inflated Poisson model (ZIP)............ 30
2.9 Sample Selection Bias.................................... 32
2.9.1 Heckit model.................................. 32
2.10 Simultaneous Equations Model..................................... 33
2.10.1 two-stage least squares (2SLS) and instrument variable................... 33
2.10.2 Simultaneous Equations Model Estimation: Seemingly Unrelated Regression (SUR)... 34
2.11 Proxy Variables....... 35

Download

You may download it from GitHub: http://github.com/cloudly/Play-Econometrics-with-R/downloads (I'll keep updating this page)

Please tolerate the mistakes and typo, as well as some formatting problems I need to come over in the future.

News and Feedback

If you want to keep up with the latest news of this brochure, please send an email to: publication@cos.name or cloudlychen@gmail.com

Your feedback is welcome! Please also send to publication@cos.name or cloudlychen@gmail.com

What‘s Next?

I'm currently working on Chapter 4 Panel Data Analysis (so I skip Chapter 3 Time Series temporarily). Chapter 4 will include several interesting methods, like Fixed / Random Effect, Panel Data tests and GMM estimator, etc. Please tell me what you are looking for in my brochure and I'll add them if possible.

Beginning: Play Econometrics with R

More than  a month without updating... Yes, I was busy doing something else, and that was traveling. I was lucky enough to enjoy a period of free time, and relaxed myself pretty well.

Now it is the time to start something useful, since the spring festival has gone. I need to be responsible for my promise. Therefore, I choose to begin to write the brochure about econometrics and R, the most up-to date statistic software.

Name

Play Econometrics with R

I use "play" to avoid being responsible for any potential academic faults 🙂 Indeed, I will correct the bugs as soon as I know.

Aim

In this brochure, I'll introduce typical econometric methods one by one and their realization in R. Of course, a huge volume of examples and data will appear (and that is the most knotty problem for me at the moment). I'll cover some public examples (i.e. published ones from current books,  e.g Introductory Econometrics: A Modern Approach by Jeffrey M. Wooldridge), and also some meaningful ones (applications in different fields) from scholar articles with data published. I should admit it is a really challenging task, and I need many helps from friends.

Readers

I hope this brochure can be helpful for those groups:

  • the statistics students who begin to know and  use econometrics, especially for economic problems.
  • the economics students who want to improve their analysis with a more powerful tool -- R, instead of Stata or SPSS.

This brochure will help the first group see how econometrics functions in economic analysis, and will bring introductory guide for the second group.

Remarks

More features needed to be announced here:

  • This brochure is totally free, and will published regularly on the Internet. If possible, it will be realized with the help through Git of Cos.name, the biggest online statistics community in China.
  • I'll use Latex (Lyx) + Sweave + R as my tools. For more information about this combination, please see here (in Chinese from Yihui's Blog) .
  • At present, this brochure will be written in Chinese (I'm really sorry). But after several revisions, and if anyone calls for needs, I will rewrite another version in English.