Category Archives: notes

Random Discovery from the City Lights, San Francisco

Having heard about the City Lights bookstore for a while, finally I got an idle afternoon to check out this cultural place. It was impressive that how the store encouraged people to read -- signs saying "have a seat + read a book" were everywhere.

I went to the poetry room and found a seat in the corner. The room was very quite in the afternoon with a ray of sunshine coming in through the window. Everything was just perfect to have a seat and read. So I picked a book randomly and started to read. I was expecting to read a poetry book but it turned out that the book was actually about Afghanistan -- stories about Afghanistan behind a collection of lansays. The name of the book was I Am the Beggar of the World: Landays from Contemporary Afghanistan.

I was more interested in reading and feeling the stories. To be honest, I only had limited knowledge of the middle east (or the West Asia), in spite of a fortunate trip to Israel this summer. When thinking about Afghanistan, my reactions were the American-Taliban war, withdrawal of American armies from Afghanistan, and some pieces of memories on the sharp contrast of Afghanistan in 50 years ago v.s. today. The book records some real stories in Afghanistan -- sex, rape, slave, war, marriage, family, exchange, education. Some brutal stories happened simply because people had no other choice. A vivid example is women's roles in a family. In the early days, women were responsible for bringing drinkable water to the family, and at that time they used containers like jugs to carry water from rivers to their houses. Recently, some families started to dig deep well to extract water directly from the underground so women no longer had to go out and carry water back. The interesting part was that because of the risk of rape and kidnap, women were not allowed to go out if not necessary, then it became hard for young girls to meet young boys. As a result, young people had fewer chances to meet each other. This side effect makes it harder to judge whether that technology improvement was good or bad; however, the wide applications of Internet (e.g. facebook) have significantly and positively impacted people's lives, as this lansay shows.

IMG_3319

Continue reading

about GDP

Happen to see this:

In nominal terms — the most appropriate measure when judging an economy’s global impact — India’s output is one-fifth that of China’s. India makes up a mere 2.5 per cent of global GDP against a hefty 13.5 per cent for China. If China grew at 5 per cent annually, it would add an Indian-sized economy to its already hefty output in less than four years. Saying India can match this is like saying a mouse can pull a tractor.

Then quickly checked China's GDP data...almost doubled since 6 years ago? (2009-2015). It is not just the math thing... not only add another India, China has already added another Japan-size economy. But wait, what does GDP mean for everyone?

That's like the question I had when I was wandering in streets in Tel Aviv...How should we account for economic growth? Especially for a big and quite unbalanced economy like China. My generation is not feeling stable -- so many people have to leave their hometowns to make a life either in Big Three (Beijing or Shanghai or Guangzhou/Shenzhen). Given another decade, how much worse could it even be?

Also wait... when US was at 10T China was not even 2T (2002)... now China/US is 10/17. Who can conclude that India cannot grow like China?

Several ways to solve a least square (regression)

As far as I know, there are several ways to solve a linear regression with computers. Here is a summary.

  • Native close form solution: just . We can always solve that inverse matrix. It works fine for small dataset but to inverse a large matrix might be very computations expensive.
  • QR decomposition: this is the default method in R when you run lm(). In short, QR decomposition is to decompose the X matrix to XQR where Q is an orthogonal matrix and R is an upper triangular matrix. Therefore, and then then then . Because R is a upper triangular matrix then we can get beta directly after computing Q'Y. (More details)
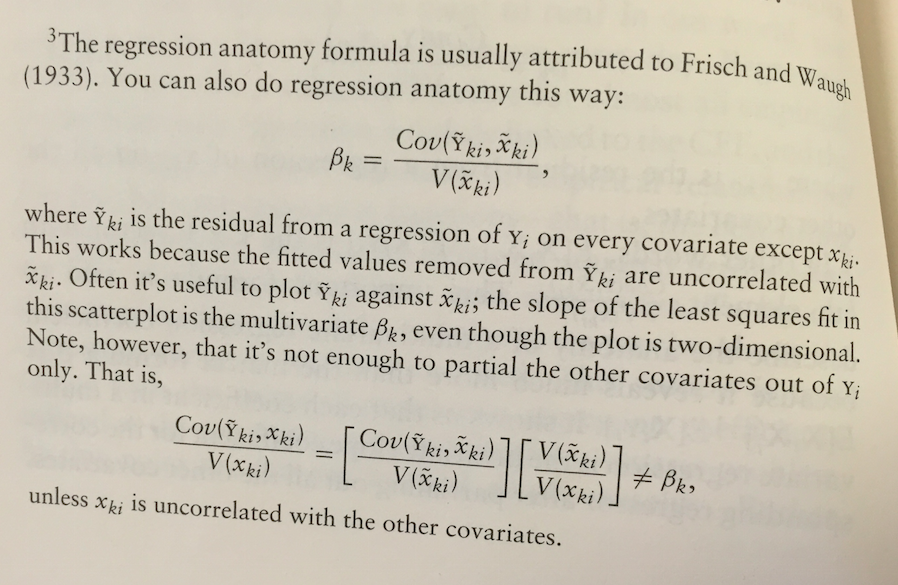
  • Regression anatomy formula: my boss mentioned it (thanks man! I never notice that) and I read the book Mostly Harmless Econometrics again today, on page 36 footnote, there is the regression anatomy formula. Basically if you have solved a regression already and just want to add an additional control variable, then you can follow this approach to make the computation easy.
    Screen Shot 2015-04-17 at 5.20.12 PM
    Especially if you have already computed a simple A/B test (i.e. only one dummy variable on the right hand side), then you can obtain such residues directly without running a real regression and then compute the estimate for your additional control variables straightforwardly. The variance estimate also follows.
  • Bootstrap: in most case bootstrap is expensive because you need to re-draw repeatably from your sample. However, if it is a very large data and it is naturally distribution over a parallel file distribution system (e.g. Hadoop), then draw from each node could be the best map-reduce strategy you may adopt in this case. As far as I know, the rHadoop package accommodates such idea for their parallel lm() function (or map-reduce algorithm).

Any other ways?

Outliers in Analysis

This is a post I wrote on company's internal wiki... just want a backup here.

Three points to bear in mind:

  1. Outliers are not bad; they just behave differently.
  2. Many statistics are sensitive to outliers. e.g. the mean and every model that relies on the mean.
  3. Abnormal detection is another topic; this post focus on exploring robust models.

Make the analysis robust to outliers:

Method
Action
Advantage
Concern
Remove the outliers remove outliers according to a certain threshold or calculation (perhaps via unsupervised models); only focus on the left subsample. In most cases the signal will be more clear from concentrated subsample. Hard to generalize the effect to entire population; hard to define a threshold.
Capping the outliers cap the outliers to a certain value. All observations are kept so easy to map the effect to all samples afterward; outliers' impacts are punished. softer compared to removing the outliers; hard to find the threshold or capping rule.
Control for covariates include some control variables in the regression. some how analyze the "difference" but not just linear and constant difference. Introduce some relevant factors to gain a precise estimation and better learning. Need to find the right control variable. Irrelevant covariates will only introduce noise.
Regression to the median Median is more robust than the mean when outliers persist. Run a full quantile regression if possible; or just 50% quantile which is the median regression. Get a clear directional signal; robust to outliers so no need to choose any threshold. Hard to generalize the treatment effect to all population.
Quantile Regression Generalized model from above; help you understand subtle difference in each quantile. Gain more knowledge on the distribution rather than single point and great explanation power. Computational expensive; hard for further generalization;
Subsample Regression Instead of regress to each quantile, a subsample regression only run regression within each strata of the whole sample (say, sub-regression in each decile). Identical to introducing a categorical variable for each decile in regression; also help inspect each subsample. only directional; higher accumulated false-positive rate.
Take log() or other numerical transformations It's a numerical trick that shrink the range to a narrower one (high punishment on the high values). Easy to compute and map back to the real value; get directional results. May not be enough to obtain a clear signal.
Unsupervised study for higher dimensions This is more about outlier detection. When there are more than one dimension to define an outlier, some unsupervised models like K-means would help (identify the distance to the center). deals with higher dimensions exploration only.


Rank based methods Measure ranks of outcome variables instead of the absolute value. immunized to outliers. Hard to generalize the treatment effect to all population.


That's all I could think of for now...any addition is welcome 🙂

------- update on Apr 8, 2016 --------

Some new notes:

  1. "outliers" may not be the right name for heavy tails.
  2. Rank methods.