Author Archives: Liyun
Several ways to solve a least square (regression)
As far as I know, there are several ways to solve a linear regression with computers. Here is a summary.
- Native close form solution: just
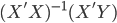 . We can always solve that inverse matrix. It works fine for small dataset but to inverse a large matrix might be very computations expensive.
 - QR decomposition: this is the default method in R when you run lm(). In short, QR decomposition is to decompose the X matrix to X = QR where Q is an orthogonal matrix and R is an upper triangular matrix. Therefore,
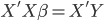 and then
 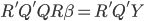 then
then 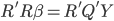 then
then  . Because R is a upper triangular matrix then we can get beta directly after computing Q'Y. (More details)
 - Regression anatomy formula: my boss mentioned it (thanks man! I never notice that) and I read the book Mostly Harmless Econometrics again today, on page 36 footnote, there is the regression anatomy formula. Basically if you have solved a regression already and just want to add an additional control variable, then you can follow this approach to make the computation easy.
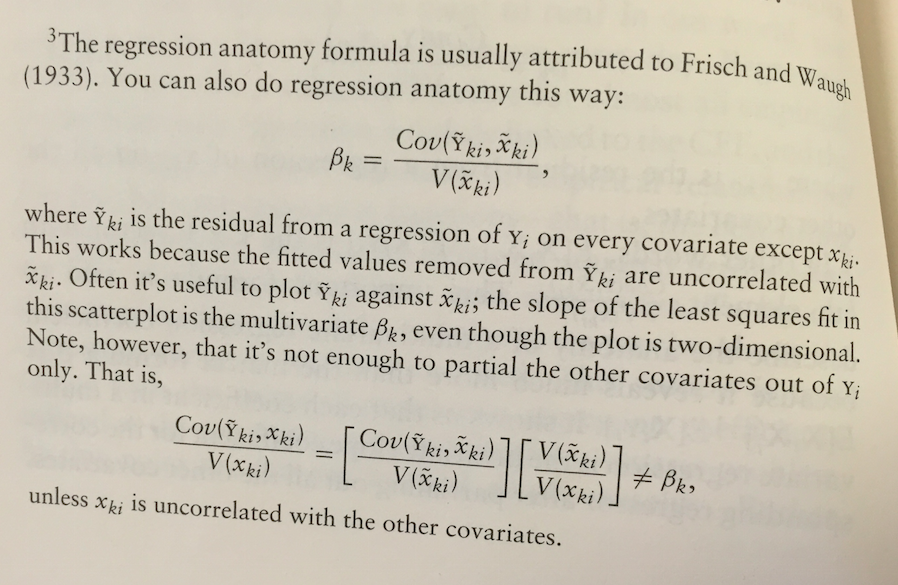
Especially if you have already computed a simple A/B test (i.e. only one dummy variable on the right hand side), then you can obtain such residues directly without running a real regression and then compute the estimate for your additional control variables straightforwardly. The variance estimate also follows. - Bootstrap: in most case bootstrap is expensive because you need to re-draw repeatably from your sample. However, if it is a very large data and it is naturally distribution over a parallel file distribution system (e.g. Hadoop), then draw from each node could be the best map-reduce strategy you may adopt in this case. As far as I know, the rHadoop package accommodates such idea for their parallel lm() function (or map-reduce algorithm).
Any other ways?
Outliers in Analysis
This is a post I wrote on company's internal wiki... just want a backup here.
Three points to bear in mind:
- Outliers are not bad; they just behave differently.
- Many statistics are sensitive to outliers. e.g. the mean and every model that relies on the mean.
- Abnormal detection is another topic; this post focus on exploring robust models.
Make the analysis robust to outliers:
|
Method
|
Action
|
Advantage
|
Concern
|
|---|---|---|---|
| Remove the outliers | remove outliers according to a certain threshold or calculation (perhaps via unsupervised models); only focus on the left subsample. | In most cases the signal will be more clear from concentrated subsample. | Hard to generalize the effect to entire population; hard to define a threshold. |
| Capping the outliers | cap the outliers to a certain value. | All observations are kept so easy to map the effect to all samples afterward; outliers' impacts are punished. | softer compared to removing the outliers; hard to find the threshold or capping rule. |
| Control for covariates | include some control variables in the regression. some how analyze the "difference" but not just linear and constant difference. | Introduce some relevant factors to gain a precise estimation and better learning. | Need to find the right control variable. Irrelevant covariates will only introduce noise. |
| Regression to the median | Median is more robust than the mean when outliers persist. Run a full quantile regression if possible; or just 50% quantile which is the median regression. | Get a clear directional signal; robust to outliers so no need to choose any threshold. | Hard to generalize the treatment effect to all population. |
| Quantile Regression | Generalized model from above; help you understand subtle difference in each quantile. | Gain more knowledge on the distribution rather than single point and great explanation power. | Computational expensive; hard for further generalization; |
| Subsample Regression | Instead of regress to each quantile, a subsample regression only run regression within each strata of the whole sample (say, sub-regression in each decile). | Identical to introducing a categorical variable for each decile in regression; also help inspect each subsample. | only directional; higher accumulated false-positive rate. |
| Take log() or other numerical transformations | It's a numerical trick that shrink the range to a narrower one (high punishment on the high values). | Easy to compute and map back to the real value; get directional results. | May not be enough to obtain a clear signal. |
| Unsupervised study for higher dimensions | This is more about outlier detection. When there are more than one dimension to define an outlier, some unsupervised models like K-means would help (identify the distance to the center). | deals with higher dimensions | exploration only.
|
| Rank based methods | Measure ranks of outcome variables instead of the absolute value. | immunized to outliers. | Hard to generalize the treatment effect to all population.
|
That's all I could think of for now...any addition is welcome 🙂
------- update on Apr 8, 2016 --------
Some new notes:
- "outliers" may not be the right name for heavy tails.
- Rank methods.
Why I think p-value is less important (for business decisions)
This article only stands for my own opinion.
When the Internet companies start to embrace experimentation (e.g. A/B Testing), they are told that this is the scientific way to make a judgement and help business decisions. Then statisticians teach software engineers the basic t-test and p-values etc. I am not sure how many developers really understand those complicated statistical theories, but they use it as way -- as a practical method to verify if their product works.
What do they look at? Well, p-value. They have no time to think about what "Average Treatment Effect" is or what the hell "Standard error and Standard deviations" are. As long as they know p-value helps, that's enough. So do many applied researchers who follow this criteria in their specialized fields.
In the past years there are always professionals claiming that p-values is not interpreted in the way that people should have done; they should look at bla bla bla... but the problem is that there is no better substitute to p-value. Yes you should not rely on a single number, but will two numbers be much better? or three? or four? There must be someone making a binary Yes/No decision.
So why do I think that p-value is not as important as it is today for business decisions as what I wrote in the title? My concern is that how accurate you have to be. Data and statistical analysis will never give you a 100% answer that what should be done; any statistical analysis has some kind of flaws (metrics of interest; data cleaning; modelling, etc.) -- nothing is perfect. Therefore, yes p-value is informative, but more like a directional thing. People make decisions anyway without data, and there is no guarantee that this scientific approach provides you the optimal path of business development. Many great experts have enough experience to put less weight on a single experiment outcome. This is a long run game, not one time.
Plus the opportunity cost -- experiment is not free lunch. You lose the chance to improve user's experience in the control group; you invest in tracking all the data and conduct the analysis; it takes time to design and run a proper test, etc. If it is a fast-developing environment, experiments could barely tell anything about the future. Their predictive power is very limited. If you are in a heavy competition, go fast is more important than waiting. Therefore instead of making adaptive decisions based on each single experiment, just go and try everything. The first decision you should make is how much you want to invest in testing and waiting; if the cost of failure product is not high, then just go for it.
I love these cartoons from the book "How Google Works". You have to be innovative in the Internet industry because you are creating a new world that no body could imagine before.